
Pharmaceutical Methods
Publishing Quality Research & Reviews

Pharmaceutical Methods
Publishing Quality Research & Reviews
Research - (2022) Volume 13, Issue 1
Received: Feb 01, 2022, Manuscript No. PHMETHODS-22-53078; Editor assigned: Feb 04, 2022, Pre QC No. PHMETHODS-22-53078 (PQ); Reviewed: Feb 18, 2022, QC No. PHMETHODS-22-53078; Revised: Feb 25, 2022, Manuscript No. PHMETHODS-22-53078 (R); Published: Mar 04, 2022, DOI: 10.35248/2229-4708.22.13.226
A simple, rapid, accurate, robust and reproducible RP HPLC method has been developed and validated for the analysis of FTC, TFV and EFV in drug substances. The chromatographic quantification was carried out using Inertial ODS-3V column C18 (250 × 4.6 mm, 5 μm) with MP composition of ACN: 1%IPA in 80:20%v/v at flow rate 1 mL/min and temperature of 30°C. UV Spectrophotometric detection was employed at 256 nm, the Rt was found to be 2.4, 2.8 and 5.2 min. The detector response was linear in the range of 5-25, 7.5-37.5 and 15-45 μg/ml respectively. The LOD and LOQ of were found to be 0.065 tom 0.198 μg/ml respectively. The precision values, expressed as % RSD values were 0.30, 0.52 and 0.23. The tablet % assay of FTC,TFV AND EVF was found 101.83, 98.26 and 100.17%. The accuracy was in the range of 100.4 to 100.6%. The method was successfully employed for the quantification of FTC, TFV and EFV in quality control of pharmaceuticals.
Drug, Chromatography, IPA, ICH Guidelines, TFV.
AIDS: Acquired Immune Deficiency Syndrome; RP-HPLC: Reverse Phase High Performance Liquid Chromatography; MP: Mobile Phase; ACN: Acetonitrile; ODS: Octadecylsilane; gms: Grams; FTC: Emtricitabine; EFV: Efavirenz; TFV: Tenofovir; Rt: Retion time; min: Minutes; %: Percentage; μg: Micro Grams; μm: Micro Meters; mm: Millimetres; mL: Millilitres; LOD: Limit of Detection; LOQ: Limit of Quantification; HIV: Human Immunodeficiency Virus; HIV-1 RT: Human Immunodeficiency Virus Type-1 Reverse Transcriptase; RNA: Ribonucleic Acid; DNA: Deoxyribonucleic Acid; d-AMP: Deoxy-Adenosine Monophosphate.
FTC is chemically 4-amino-5-fluoro-1-[(2R,5S)-2-(hydroxymethyl)-1,3-oxathiolan-5-yl]pyrimidin-2-one (Fig. 1). It is nucleoside reverse transcriptase inhibitor. FTC is an analogue of cytidine. It works by inhibiting the reverse transcriptase enzyme which copies the HIV RNA into viral DNA. So that it can help to lower the amount of viral load in patient’s body. It leads to increase the immune system cells [1].
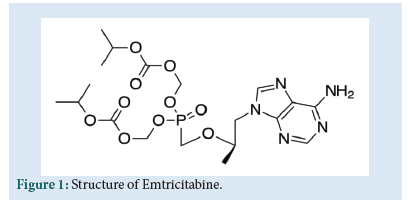
Figure 1: Structure of Emtricitabine.
TFV is chemically [(2R)-1-(6-aminopurine-9-yl) propan-2-yl] oxymethylphosphonic acid (Fig. 2). It is an acyclic analogue of deoxyadenosine 5'-monophosphate (d-AMP). That lacks a hydroxyl group in the position corresponding to the 3' carbon of the d-AMP, preventing the formation of the 5′ to 3′ phoshodiester linkage, which is essential for DNA chain elongation. It causes premature termination of DNA transcription, preventing viral replication [2].
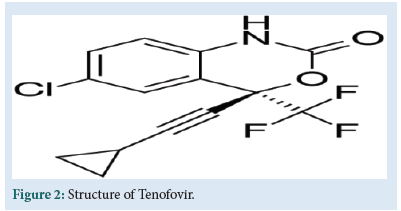
Figure 2: Structure of Tenofovir.
EFV is chemically (4S) 6 – chloro – 4 (2 – cyclopropylethynyl) – 4 – (trifluoromethyl) – 1 – H – 3,1 – benzoxazin-2 – one (Fig. 3).
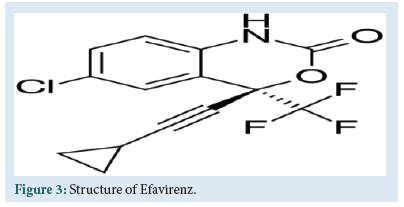
Figure 3: Structure of Efavirenz.
EFV is a non-nucleoside reverse transcriptase inhibitor. It directly binds to the HIV– 1 RT and RNA dependent DNA polymerase, block-ing its function to DNA replication. It leads to reduce HIV viral load, retarding damage to the immune system and reduce the risk of devel-oping AIDS.
Combination of these three drugs is to target the HIV reverse tran-scriptase protein in three ways, which reduces the virus capacity to mu-tate. In combination of three drugs synergic antiviral effects observed [3].
Literature review reveals that analytical methods based on U.V. Spec-trophotometric methods, RP-HPLC and stability indicating studies for the determination of these 3 drugs in different combinations. So based on the review of literature we attempted a simple, precise, accurate and reproducible method [4].
Determination of solubility of drugs
Drugs were dissolved in different solvents and solubility was checked. Solubility was found good in 1% IPA, methanol and slightly solu-ble in water and acetonitrile. Hence ACN and 1% IPA in the ratio of 80:20%v/v were used as a solvent for solubility of drug.
Preparation of FTC, TFV and EFV standard solution
Weighed separately and transferred accurately 10 mg of FTC, TFV and EFV standard in to 10 ml volumetric flask. Then added about 4 ml of diluent and sonicated to dissolve completely and make up to the mark with same solvent to 10 ml (1000 μg/ml).
Preparation of FTC, TFV and EFV working standard solution Take 0.1 ml standard solution of FTC, TFV and EFV in to 10 ml vol-umetric flask. Then added about 4 ml of diluent and sonicated to dis-solve completely and make up to the mark with same solvent to 10 ml (10 μg/ml).
Preparation of 1% IPA
An accurately measured 1 ml of IPA and transferred in to 100 ml volu-metric flask, make up to the 100 ml with HPLC water.
Optimization of RP-HPLC method
The HPLC method was optimized with an aim to develop a procedure, for the method optimization different mobile phases were tried, but acceptable retention times, theoretical plates and good resolution were observed with ACN: 1% IPA (80:20%v/v), flow rate 1 ml/min by us-ing Inertial C18-ODS-3V (4.6 × 250 mm × 5 μm). Validation of the RP-HPLC method Validation of the optimized method was performed according to the ICH guidelines and optimised chromatogram was shown in Fig. 4 [5-8].
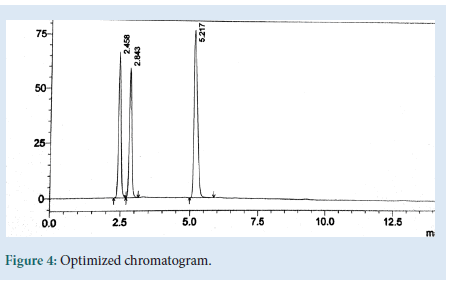
Figure 4: Optimized chromatogram.
Validation of the RP-HPLC method
System suitability:
The concentration of FTC 15 μg/ml and TFV 22.5 μg/ml and EFV 45 μg/ml solutions were prepared and injected for six times into the HPLC from the area % RSD values are calculated [9].
Linearity:
From the standard stock 0.05, 0.1, 0.15, 0.2, 0.25 ml and 0.075, 0.15, 0.22, 0.30, 0.375 ml and 0.15, 0.30, 0.45, 0.60, 0.75 ml of FTC, TFV and EFV solutions were pipetted out and transferred in to 10 ml volumetric flask and make up the volume with diluent. The solutions were degassed and passed through 0.45 μm membrane filter for filtration. The concentrations of the FTC 5-25 μg/ml and TFV 7.5-37.5 μg/ml and EFV 15-75 μg/ml was prepared and injected.
Precision:
From the standard stock solution 0.15 ml of FTC and 0.225 ml of TFV and 0.45 ml of EFV were pipetted out and transferred separately into six 10 ml volumetric flasks and make up to the mark with diluent. The solutions were degassed and passed through 0.45 μm membrane filter for filtration. The concentration of FTC 15 μg/ml and TFV 22.5 μg/ml and EFV 45 μg/ml solutions were injected for six times into the HPLC in the same day and three conjugative days the area for all six injections were measured and results was shown in table (Table 1).
| Drug name | Concentration | Average concentration |
Average % |
S.D | %RSD |
|---|---|---|---|---|---|
| Emtricitabine | 15 | 14.73 | 98.27 | 0.0045 | 0.30 |
| Tenofovir | 22.5 | 23.58 | 104.8 | 0.123 | 0.52 |
| Efavirenz | 45 | 45.78 | 101.6 | 0.018 | 0.23 |
Table 1: Precision: Three conjugative days the area for all six injections.
Accuracy
Three concentrations of 50%, 100%, and 150% are prepared and injected.
Preparation of sample solution:
The average weight of tablets were determined by weighing 20 tablets and powdered. Tablet powder was equivalent to 10 mg of FTC, 15 mg of TFV and 30 mg of EFV were weighed and transferred into 10 ml volumetric flask about 4 ml of diluents was added and degassed for 15 min for the complete dissolution of the drug, volume was made up to the mark with diluent and mixed. Above solution was filtered through what’ man filter paper number 41.
Preparation of 50%, 100% and 150% solutions:
From the sample solution, pipetted out 0.15 ml and transferred into three separate 10 ml volumetric flasks; to the volumetric flasks 0.075, 0.1125 and 0.225 ml, 0.15, 0.22 and 0.45 ml, 0.225, 0.3375 and 0.675 ml of FTC, TFV and EFV standard solutions were added to get 50%, 100% and 150% solutions and make up to the mark with diluent and degassed. The solutions were filtered through 0.45 microns membrane filter and injected into the system. From the results percentage recovery was calculated and the results were shown in table (Table 2).
| Name of the drug | LOD(µg/ml) | LOQ(µg/ml) |
|---|---|---|
| Emtricitabine | 0.065 | 0.198 |
| Tenofovir | 0.22 | 0.66 |
| Efavirenz | 0.09 | 0.29 |
Table 2: Limit of detection and limit of quantification.
Limit of detection and limit of quantification
The limit of detection and the limit of quantification were calculated by using the average value of slope and the standard deviation of intercept and the results are listed in the table, results was shown in table (Table 3).
| S. No. |
Parameters | Normal | Variation | %Recovery | ||
|---|---|---|---|---|---|---|
| Emtricitabine | Tenofovir | Efavirenz | ||||
| 1 | Wavelength | 256 nm | 251 | 111.5 | 93.25 | 157.8 |
| 261 | 92.87 | 107.8 | 40.7 | |||
| 2 | Temperature | 30°C | 25 | 109.5 | 116.7 | 112.9 |
| 35 | 109.25 | 116.8 | 112.85 | |||
| 3 | Flow rate | 1 ml/min | 0.8 | 123.5 | 133.15 | 127.2 |
| 1.2 | 84.4 | 89.9 | 85.65 | |||
Table 3: Robustness studies: Variations were made to the optimized HPLC conditions.
Robustness
Deliberate variations were made to the optimized HPLC conditions, to evaluate robustness were:
Wavelength varied by ± 5 nm
Column oven temperature varied by ± 50°C
Flow rate varied by ± 0.2 ml/min
Assay
The average weight of tablets were determined by weighing 20 tablets, powdered, 1.7 gms of equivalent weight of tablet powder was weighed,transferred into 10 ml volumetric flask and about 4 ml of diluent was added, degassed for 15 minutes for the complete dissolution of drug, volume was made up to the mark with diluent and mixed. Above solution was filtered through what’s man filter paper. From the above solution 1 ml was pipetted out and transferred into 10 ml volumetric flask and made up to the mark with diluent. This solution was used for assay studies; assay calculation details mentioned in table (Tables 4 and 5).
| Name of the drug | Label claim (mg) | Amount found (mg) |
Assay % | %RSD |
|---|---|---|---|---|
| Emtricitabine | 10 | 10.18 | 101.83 | 0.76 |
| Tenofovir | 15 | 14.74 | 98.26 | 0.05 |
| Efavirenz | 30 | 30.06 | 100.17 | 0.42 |
Table 4: Tablet assay studies: The chromatogram of assay.
| Validation parameters | Acceptance criteria | Results | ||
|---|---|---|---|---|
| Emtricitabine (FTC) | Tenofovir (TFV) | Efavirenz (EFV) | ||
| System suitability | The % RSD of should be NMT 2.0%. | 0.256 | 0.459 | 0.214 |
| Linearity | R2 should be NLT 0.999. | 0.999 | 0.999 | 0.999 |
| Intraday precision | The % RSD of should be NMT 2.0%. | 0.30 | 0.52 | 0.23 |
| Intermediate precision | The % RSD should be NMT 2.0%. | 0.23 | 0.30 | 0.24 |
| Accuracy | The % recover should be 98.0% to 102% | 100.4 | 100.36 | 100.58 |
| LOD (µg/ml) | _ | 0.065 | 0.22 | 0.66 |
| LOQ (µg/ml) | _ | 0.198 | 0.09 | 0.29 |
Table 5: Summary of Validation parameters: Acceptance criteria of FTC, TFV and EFV.
Chromatographic parameters were optimized to develop a HPLC method for the simultaneous estimation of Emtricitabine, Tenofovir and Efavirenz, short analysis time (<6 min) and acceptable resolution (Rs>2) various composition of Mobile phases were tried at flow rate of 1 ml/min. Acetonitrile and 1%IPA in ratio of 80:20 showed symmetrical peaks with good resolution. The optimum Wavelength for detection was 256 nm and the RT was found to be 2.45, 2.84 and 5.21 mins respectively. Linearity curve was obtained in the concentration range of 5-25, 7.5-37.5 and 15-75 μg/ml. LOD and LOQ were 0.065, 0.22, 0.09 and 0.198, 0.66, 0.29 μg/ml determined from the slope and SD of Y-intercept of regression line of the calibration curve. The precision of the method, instrument precision were evaluated and % R.S.D values were 0.30, 0.52 and 0.23 (less than 2%). The accuracy was in the range of 100.4 to 100.6% close to 100% which complies with ICH Guidelines. Developed method was found to robust while changing the flow rate wavelength detection, temperature (Fig. 5).
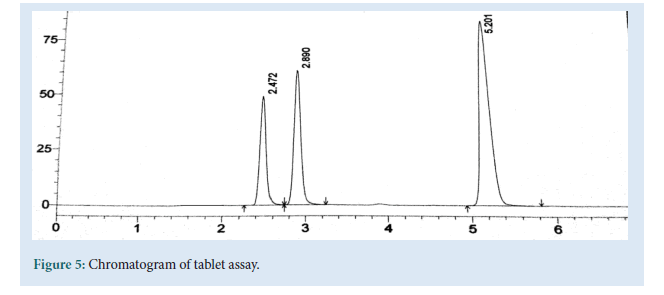
Figure 5: Chromatogram of tablet assay.
The proposed method was developed and validated using ACN: 1% IPA in the ratio of 80: 20%v/v. IPA was used to enhance the selectivity with binary/trinity mixtures as it is a transition eluent between aqueous and non-aqueous eluents and is a co-solvent miscible with water, so it was used as a part of aqueous mobile phase.
The proposed method was simple, isocratic, sensitive, reproducible, accurate, precise and has low percentage relative standard deviation, lower linearity range, simple mobile phase i.e., without using buffers when compared with the existing methods. The analysis time for the developed method was less when compared to the existing methods so this method can be applied for the analysis of multiple samples in less time. Hence the proposed method was found to be novel, simple, accurate and robust and validation studies indicating that the proposed method was suitable for the routine analysis of the combined dosage form.
Firstly I would like to express our sincere thanks to the Management and Dr. P. Raviprakash, Professor and Principal, Dr. S V Suresh Kumar, Professor and Vice Principal, Dr. D. Madhuri, Professor and Head of the Department, Creative Educational Societies College of Pharmacy for the facilities, requirements and support during the research work.
All the authors have read and approved the manuscript.
[Crossref], [Google scholar].
[Crossref], [Google scholar].
[Crossref], [Google scholar].